How cooling is studied
Before a data hall is built, its designers can model the air inside it on a computer: where it flows, where it warms up and where the pressure changes. This page walks through one such study, of a ModFlex room with 12 racks and 600 kW of IT load, and explains what each picture and number means.
Preliminary CFD A preliminary steady-state study by Eliovp, which also publishes this site. The inputs are scenario settings, not a certified capacity rating.
What CFD is
Computational fluid dynamics (CFD) calculates how a fluid, here air, moves through a space. The software divides the room into a grid of small cells and solves the equations of fluid flow in each one for air speed, temperature and pressure. The edges of the model, such as walls, rack intakes and rack doors, need fixed physical conditions, called boundary conditions (NASA). The answer depends on those settings, which is why a study states them.
Designers run it because a data hall has to get cool air to every rack intake and carry the hot exhaust away without the two mixing. The DOE's best-practice guide calls this air management: it stops cooling air from bypassing the intakes and hot exhaust from recirculating back into them (DOE guide). CFD lets a team test a layout for these problems before anything is built, and try other working conditions at low cost (Jiang, 2024).
The temperature that matters most is the air going into the servers. ASHRAE recommends 18 to 27 °C for air-cooled IT equipment, and allows 15 to 32 °C for its class A1 (DOE guide, table 3-1).
The room in the study
The study models one ModFlex room, 13.416 m long, 4.700 m deep and 2.836 m high, with 12 racks and 600 kW of planned IT load. Each rack has a rear-door heat exchanger (RDHx): a water-cooled door on the back of the rack that takes the heat out of the exhaust air right where it leaves the servers (LBNL). The cooled air goes back into the room and round to the rack fronts again.
The airflow and pressure results come from one model of 99,960 cells. The temperature case is a separate, smaller model of 9,480 cells.
01Airflow
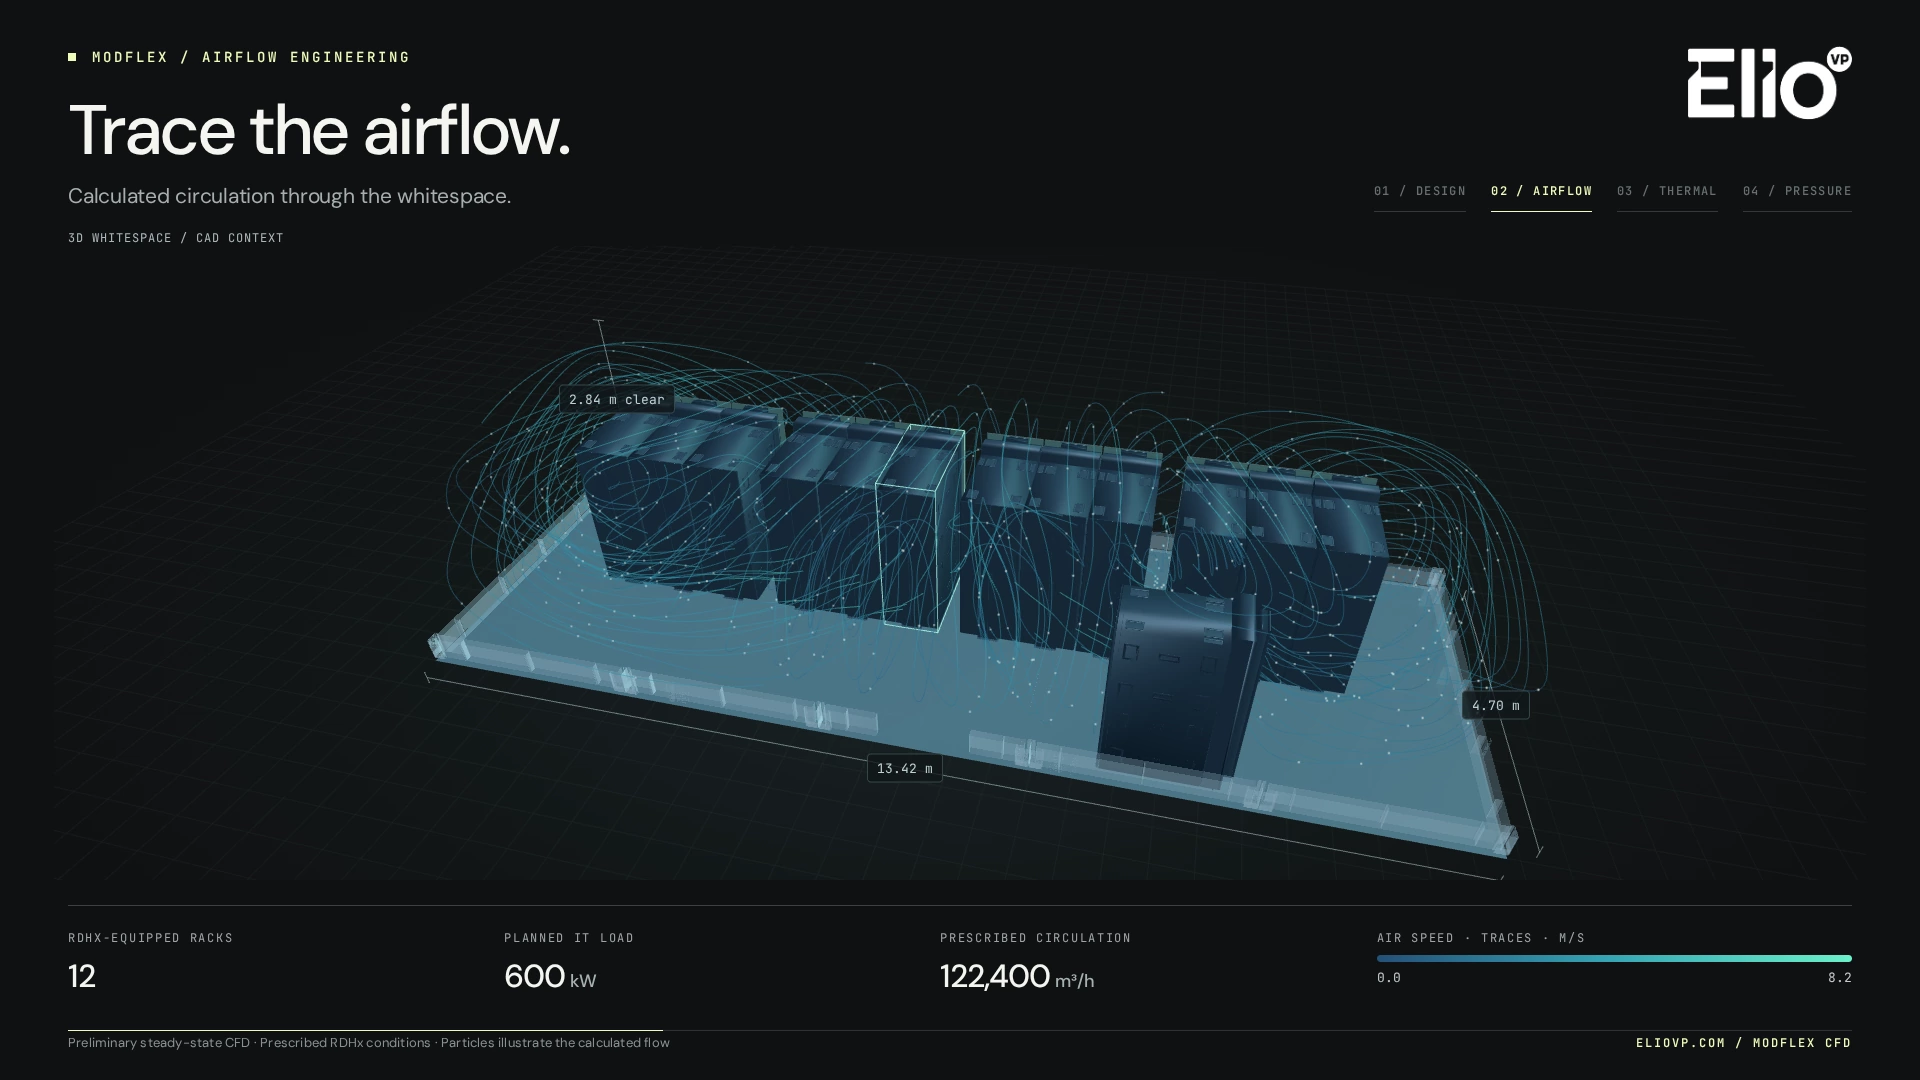
The room is seen from above at an angle, with its dimensions marked. Each thin line is a calculated air path, coloured by speed from 0 to 8.2 m/s.
Look at the loops. Air leaves the racks, curls up and over the rows and comes back down to the intakes. With rear-door coils that loop is the normal path, because the exhaust is cooled inside the door before it reaches the room. The question the picture answers is whether air reaches every rack front, and whether it stalls anywhere.
02Temperature

This is a deliberate what-if, not a recorded failure. One door, RDHx 06, is set to blow air out at 38 °C, while the other eleven are at 29 °C. The picture is a horizontal slice 1.42 m above the floor, half the room height, seen from above.
Look at how far the warm air from that one door travels before it mixes: a plume runs from the door, and a warmer patch spreads into the open floor in front of the row. The warmest air in the model is 38.0 °C, the value set at the door, and 14.3 m³ of room air is above the study's 32 °C review threshold. The 38 °C is an input, not a prediction of what a real coil would do.
03Pressure
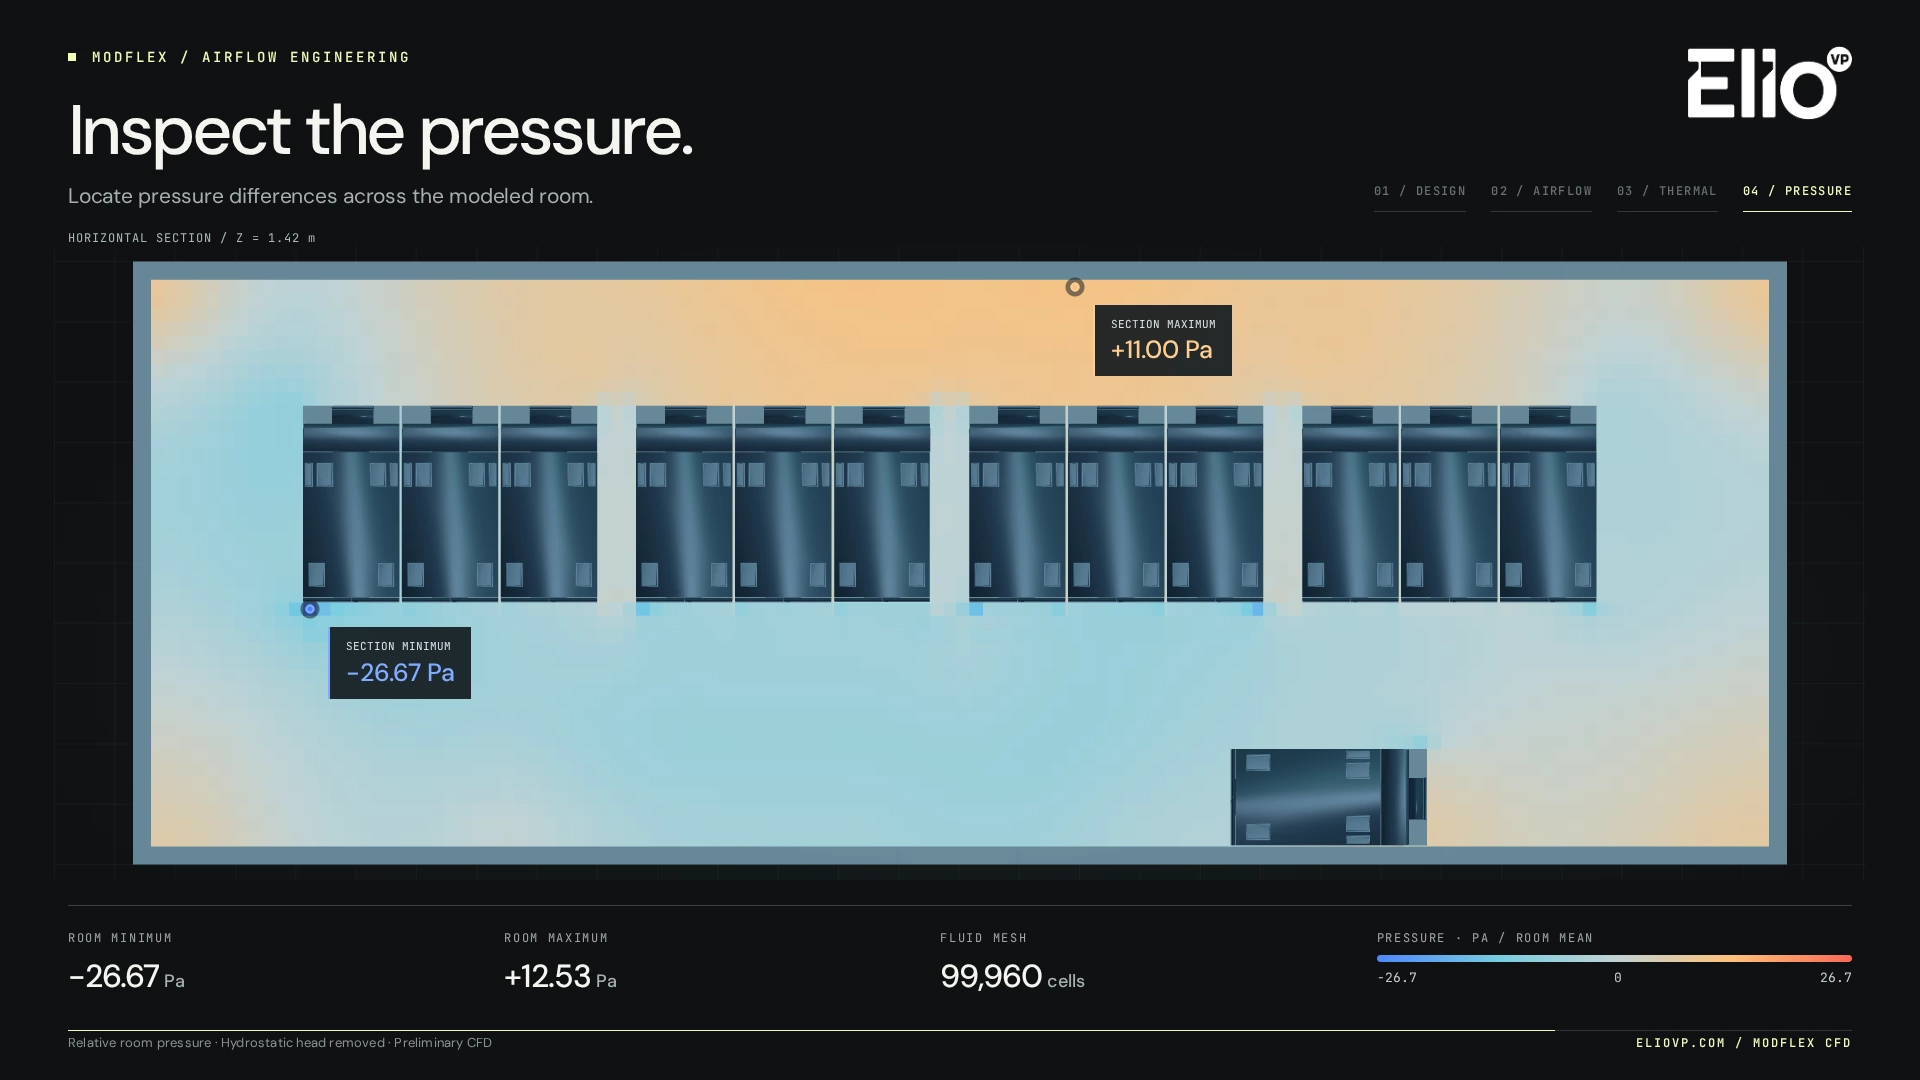
The same 1.42 m slice, coloured by pressure relative to the room average. The pressure change with height that comes from the weight of the air has been taken out, so what is left comes from the air moving.
Look at the two sides of the row: higher pressure along the wall behind it, at the top of the picture, where the doors blow out, and lower pressure along its front, where the racks draw air in. The lowest value in this slice is −26.67 Pa, near the left end of the row, and the highest is +11.00 Pa. The highest anywhere in the room is +12.53 Pa. These are room pressures, not the pressure rise across the fans.
The numbers in plain words
- Room
- 13.416 × 4.700 × 2.836 m
- Model size
- 99,960 cells
- Racks with rear doors
- 12
- Room pressure, relative to the average
- −26.67 to +12.53 Pa
- Planned IT load
- 600 kW
- Peak air speed
- 8.2 m/s
- Air moved, set as input
- 122,400 m³/h
- Warm-door case, room air above 32 °C
- 14.3 m³
What a cell count means
The model splits the room into 99,960 small blocks and works out one value of speed, temperature and pressure for each. More cells catch smaller details, such as the gap between two racks, but take longer to solve. Researchers check that a result does not change when the grid is made finer; one peer-reviewed server-room study settled on 228,718 cells after that check (Jiang, 2024). The temperature case here has 9,480 cells, which is why its picture looks blocky.
Recirculation and hot spots
The study's 122,400 m³/h is the air the racks and doors move around the room, set as an input. That is about 34 m³ every second. In air-management guides the word recirculation usually means something else: hot exhaust that finds its way back into a rack intake, which designers try to prevent (DOE guide, Jiang, 2024). With rear-door coils the exhaust is cooled before it leaves the rack, so the useful question is whether any door lets warm air out.
A hot spot is a patch of air warmer than the rest of the room. Uneven cooling causes them (Jiang, 2024), and so do obstructions such as cable bundles under a raised floor (DOE guide). The 38 °C case makes one on purpose to see how far it reaches.
Why pressure differences matter
Air flows from higher to lower pressure, so wherever there is an opening between two areas at different pressures, air moves through it. The differences in this room are a few tens of pascals at most, small, but enough to push air through a gap. That is why containment, the panels and doors that keep cold supply air and hot exhaust apart, depends on sealing: the DOE guide lists blanking empty rack slots and sealing cable openings to cut recirculation, and warns that fast air in an under-floor plenum can create local low pressure that draws room air back into it (DOE guide). A pressure map shows a designer where those pushes and pulls are before the room is built.
What the study does not show
These are preliminary steady-state results. Steady state means the model solves for one settled condition, the air as it would be after running for a long time with nothing changing. It does not show transients, such as the seconds after a fan or a pump stops, and it has no failure cases; the warm door is a set input. The moving particles in the film illustrate the solved airflow; they are not a simulation over time.
The results do not establish fan pressure rise, coil resistance, acoustics or validated cooling performance. Before anyone relies on CFD, its results have to be compared with measurements or other trusted results (NASA).
For what happens over seconds and minutes when parts fail, try the lab.
Sources
- U.S. Department of Energy FEMP and NREL (O. Van Geet, D. Sickinger), Best Practices Guide for Energy-Efficient Data Center Design, revised July 2024. Table 3-1 reproduces the ASHRAE 2021 thermal guidelines; section 4 covers air management and containment.
- D. Jiang, "Effects and optimization of airflow on the thermal environment in a data center", Frontiers in Built Environment 10 (2024), doi:10.3389/fbuil.2024.1362861.
- NASA Glenn Research Center, NPARC Alliance CFD verification and validation tutorial: "CFD analysis process".
- R. Mahdavi, Lawrence Berkeley National Laboratory for DOE FEMP, Case study: innovative energy efficiency approaches in NOAA's Environmental Security Computing Center in Fairmont, West Virginia, May 2014.
- Eliovp, ModFlex modular data centers: the CFD study, film and stills shown on this page.
Study, film and stills by Eliovp, from the CFD section of its ModFlex page.